Data Interpretation Ques 16
Directions : Refer to the following graph and answer the given questions.
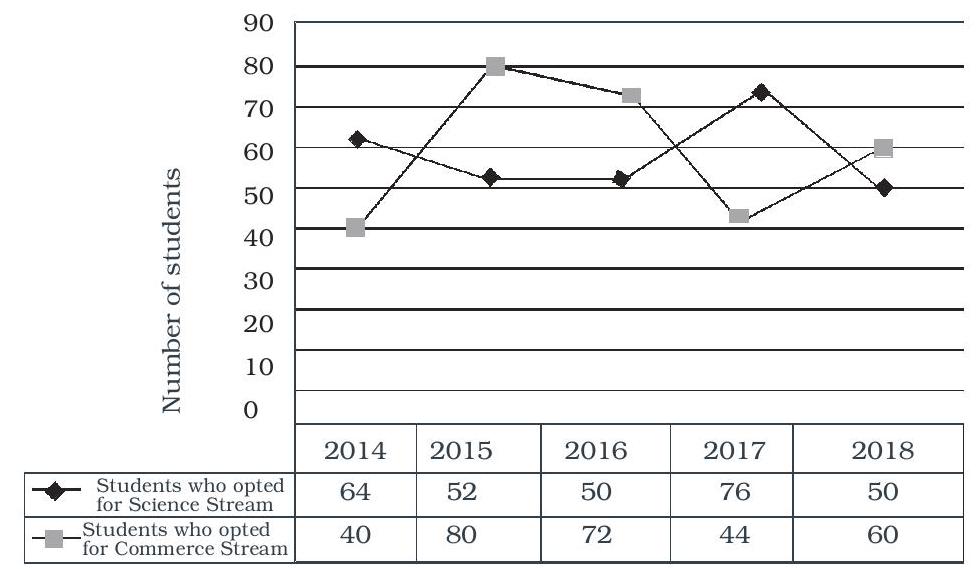
A school collected data from April 2014 to April 2018 comprising students of class XI who opted for either science stream or commerce stream
(Note : There are only two streams available in the school i.e. Science and Commerce)
What is the respective ratio between the number of students who opted for science stream in 2014 and those who opted for commerce stream in 2014?
(1) $3: 2$
(2) $2: 3$
(3) $4: 5$
(4) $4: 7$
(5) $8: 5$
Show Answer
Correct Answer: 5
Solution: (5) Required ratio $=64: 40$ $=8: 5$
Calculations (1134–1138) :
Total number of females who watch movies $=2x$ (let)
$\therefore$ Number of males who watch movies $=x$
Males who watch both movies $=$ Females who watch both movies
ies $=\frac{x}{2}$ Females who watch only movie $A=$ Females who watch only movie B $=\frac{1}{2}\left(2 x-\frac{x}{2}\right)=\frac{3 x}{4}$ Males who watch only movie A
$=\frac{3 x}{4} \times \frac{40}{100}=\frac{3 x}{10}$
$\therefore$ Males who watch only movie $B$
$=x-\frac{x}{2}-\frac{3 x}{10}$
$=\frac{10 x-5 x-3 x}{10}=\frac{x}{5}$
$\therefore \frac{3 x}{4}-\frac{x}{5}=11$
$\Rightarrow \frac{15 x-4 x}{20}=11$
$\Rightarrow 11 x=11 \times 20$
$\Rightarrow x=20$


