Data Interpretation Ques 65
Directions : Study the following graph carefully and answer the questions given below it.
Total number of students who appeared and qualified from various schools at a Scholarship Exam
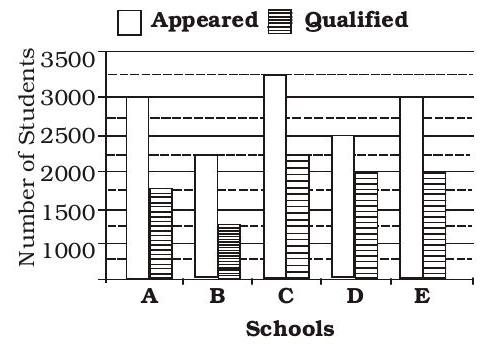
What is the respective ratio of the number of students qualified at the Scholarship examination from school A and the number of students qualified at the examination from school B?
(1) $8: 3$
(2) $5: 7$
(3) $7: 3$
(4) $9: 5$
(5) None of these
Show Answer
Correct Answer: 5
Solution: (5) Required proportion
$1750:1250=7:5$


