Data Interpretation Ques 4
Directions: The following pie charts show the percentage distribution of the sales of an educational magazine in seven different cities - B, H, T, P, R, G and $K-$ in the years 2016 and 2017 respectively. Consider the following pie-charts carefully and answer the questions given below:
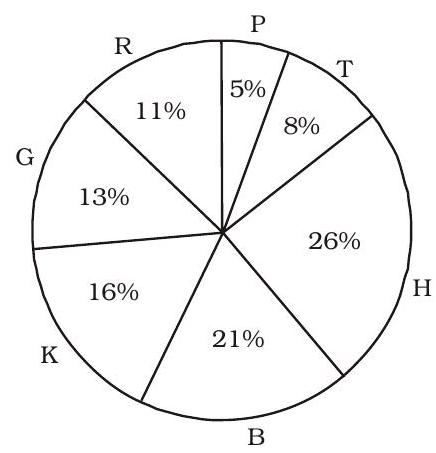
Total number of magazines sold in $2016=87600$
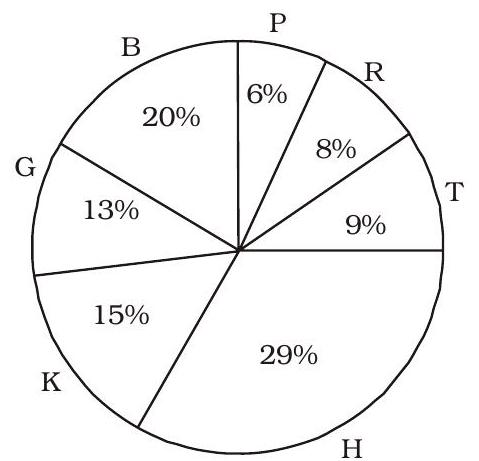
Total number of magazines sold in $2017=96900$
The number of magazines sold in city $P$ in 2016 is approximately what percent of the total number of magazines sold in city P in 2017, if there are $10 \%$ and $15 \%$ increases in sales of magazines in the years 2016 and 2017 respectively?
(1) $65 \%$
(2) $72 \%$
(3) $69 \%$
(4) $75 \%$
(5) $60 \%$
Show Answer
Correct Answer: (2)
Solution: (2) Number of magazines sold in city $P$ in :
Year 2016
$\Rightarrow 87600 \times \frac{5}{100} \times \frac{110}{100}$
$=4818$
Year 2017
$\Rightarrow 96900 \times \frac{6}{100} \times \frac{115}{100}=6686$
Required percentage
$=\left(\frac{4818}{6686}\right) \times 100$
$\approx \frac{4800}{67} \approx 72 \%$


