Data Interpretation Ques 391
Directions : The following radar diagram shows the number of new companies registered in four countries in various years. Study the following graph carefully and answer the questions given below.
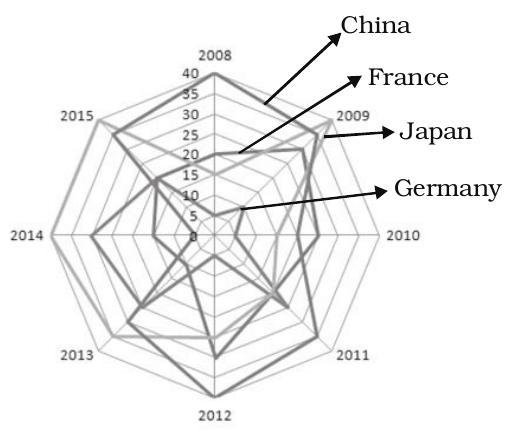
What is the ratio between the numbers of companies registered in Japan and the number of companies registered in China during 2008 to 2015 ?
(1) $19: 18$
(2) $5: 7$
(3) $12: 19$
(4) $23: 24$
(5) $10: 11$
Show Answer
Correct Answer: 391.(4)
Solution: (4) Number of companies registered in Japan during 2008 to 2015
$=230 \times 1000=230{,}000$
Number of companies registered in China during 2008 to 2015
$=240 \times 1000=240{,}000$
Required ratio $=24: 23$


