Data Interpretation Ques 389
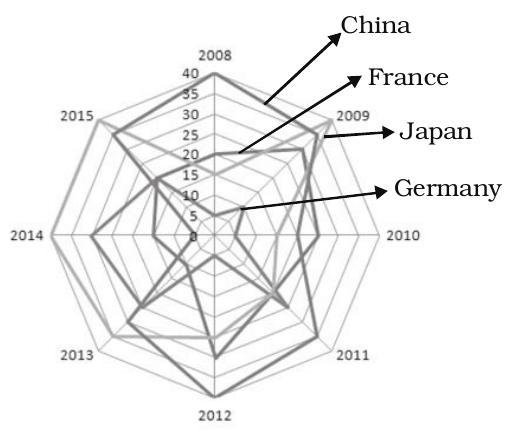
Directions : The following radar diagram shows the number of new companies registered in four countries in various years. Study the following graph carefully and answer the questions given below.
In which of the following year the average of the number of companies registered in the countries is the maximum?
(1) 2008
(2) 2009
(3) 2010
(4) 2011
(5) None of these
Show Answer
Correct Answer: (2)
Solution: (2) Average in 2008
$=(5+20+15+40) \times \frac{1000}{4}$
$=20,000$
Average in 2009.
$=(10+30+40+35) \times \frac{1000}{4}$
$=28,750$
Average in 2010.
$=(5+25+15+20) \times \frac{1000}{4}$
$=16,250$
Average in 2011.
$=(25+20+20+35) \times \frac{1000}{4}$
$=25,000$


