Data Interpretation Ques 385
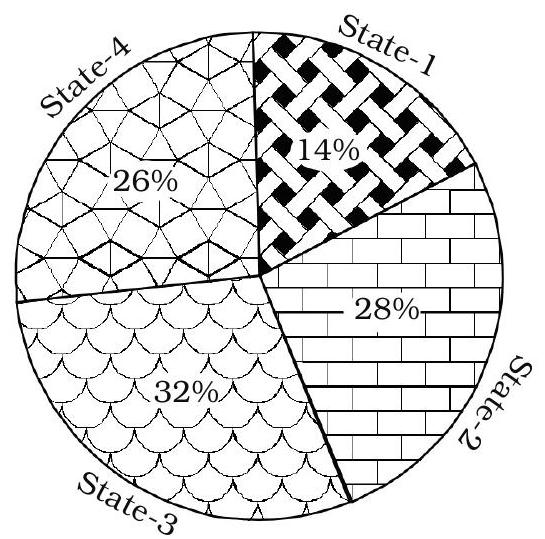
Directions : The following pie diagram shows the distribution of SUV cars given by central government to the four different state governments. The following table shows the ratio of the distribution of Petrol and Diesel engine cars to the four states.
Distribution of SUV cars in 4 states
Ratio of distribution of Diesel SUV cars and Petrol SUV cars in 4 states
| State-1 | State-2 | State-3 | State-4 | |
|---|---|---|---|---|
| Diesel Engine SUVs | 3 | 5 | 5 | 1 |
| Petrol Engine SUVs | 4 | 9 | 3 | 1 |
By what percentage the number of petrol engine cars for state-3 is more than the number of diesel engine cars for state-1 ?
(1) $75 \%$
(2) $200 \%$
(3) $150 \%$
(4) $100 \%$
(5) $125 \%$
Show Answer
Correct Answer: (4)
Solution: (4) Total number of SUVs for state $3=32 \%$ of $700=224$
Number of petrol engine SUVs for
state- $3=224 \times \frac{3}{8}=84$
Total number of SUVs for state$1=14 \%$ of $700=98$
Number of diesel engine SUVs for state- $1=98 \times\left(\frac{3}{7}\right)=42$
Required per centage
$$ =\left(\frac{(84-42)}{42}\right) \times 100=100 \% $$


