Data Interpretation Ques 372
Directions : Read the following bar graph carefully and answer the questions given below it.
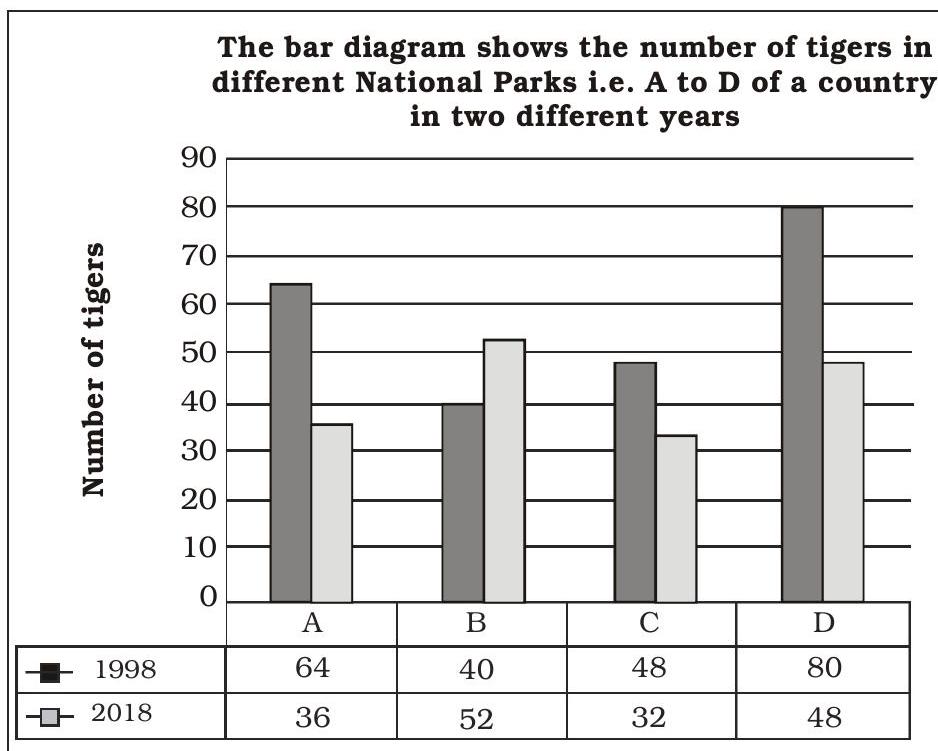
Average number of tigers in all National parks in 2018 is how much less/more than average number of tigers in all National parks in 1998 ?
(1) 14
(2) 16
(3) 18
(4) 20
(5) 22
Show Answer
Correct Answer: (2)
Solution: (2) Average number of tigers :
Year $1998 \Rightarrow \frac{64+40+48+80}{4}$
$=\frac{232}{4}=58$
Year $2018 \Rightarrow \frac{36+52+32+48}{4}$
$=\frac{168}{4}=42$
Required difference
$=58-42=16$ i.e. less


