Data Interpretation Ques 371
Directions : Read the following bar graph carefully and answer the questions given below it.
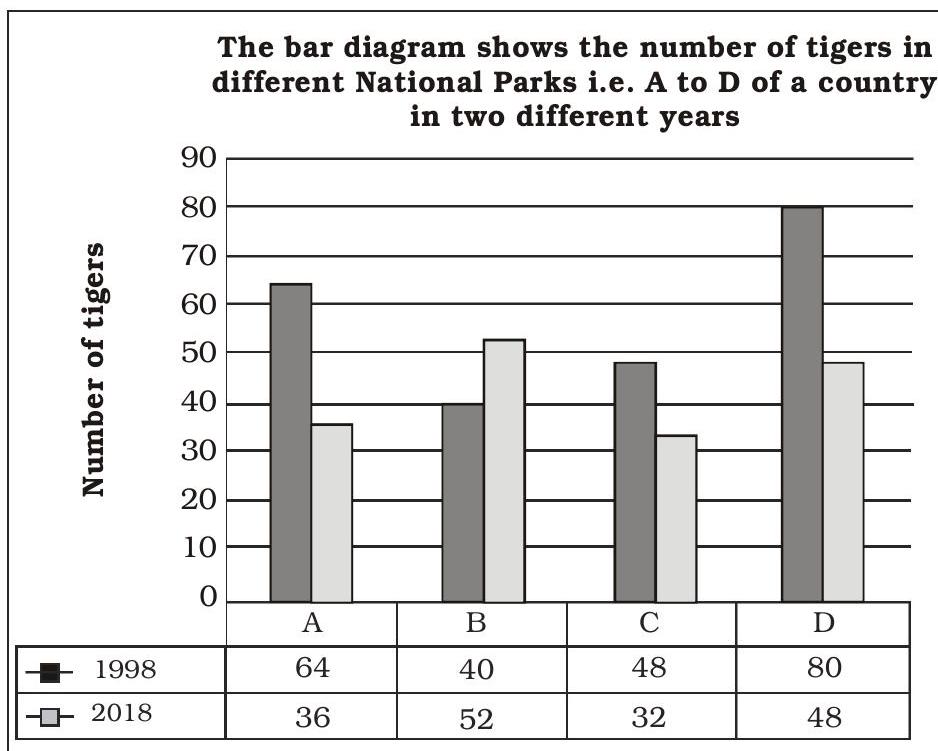
The number of tigers in National Park ’ $E$ ’ in 2018 is $40 \%$ more than the number of tigers in National Park ‘D’ in 1998 while the number of tigers in National park ’ $E$ ’ in 1998 was $25 \%$ less than the number of tigers in National Park ‘C’ in 2018. Find total number of tigers in National park ’ $E$ ’ in 1998 and 2018 together?
148
84
172
160
136
Show Answer
Correct Answer: 5
Solution: (5) Number of tigers in park E
in $2018=\frac{80 \times 140}{100}=112$
Number of tigers in park $E$ in $1998=\frac{32 \times 75}{100}=24$
$\therefore$ The required answer is $\boxed{120^\circ}$
$=112+24=136$


