Data Interpretation Ques 358
Directions : Study the bar graph and answer the given questions.
Number of hats sold by Seller A and Seller B on given days :
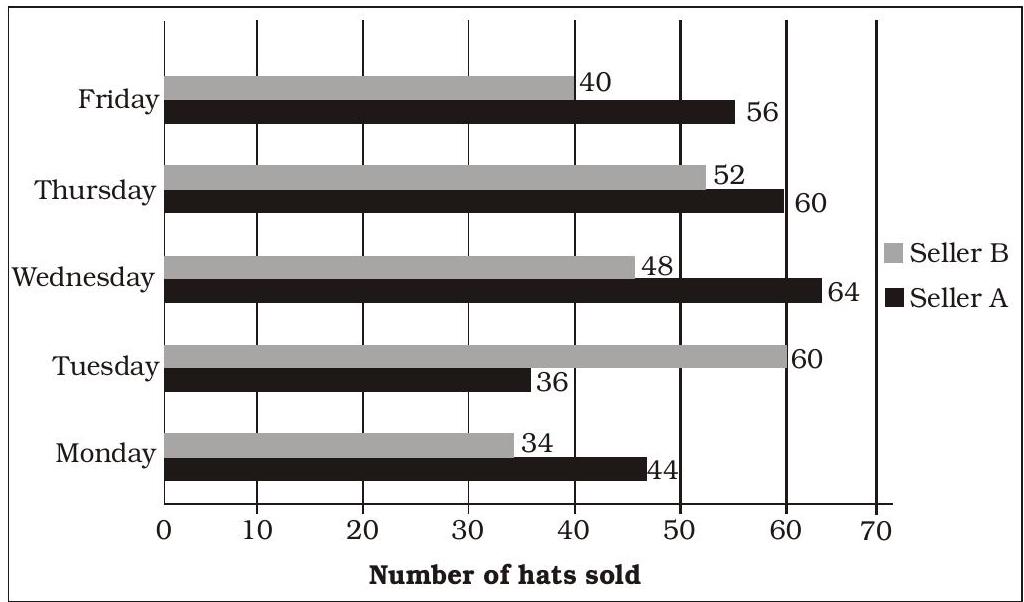
A sold $80 \%$ defective hats on Thursday and B sold $75 \%$ defective hats on the same day. Find the number of hats sold by $A$ and $B$ on Thursday that are not defective?
25
20
18
32
40
Show Answer
Correct Answer: (1)
Solution: (1) Required answer
$=\left(\frac{60 \times 20}{100}+\frac{52 \times 25}{100}\right)$
$=12+13=25$


