Data Interpretation Ques 33
Directions : The following bar graph shows the percentage of jobs available in the countries $X, Y$ and $Z$ in different years. Study the bar graph and answer the questions given below.
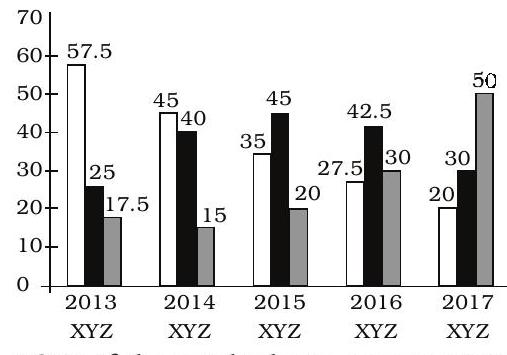
The total jobs in 2015 were three times the total jobs in country $Z$ in 2016 and also the total jobs in country $X$ in the year 2015 were 5670 . The total jobs in country X in the year 2015 were how much per cent more than the total jobs in country $Z$ in the year 2016 ?
(1) $7 \%$
(2) $7.5 \%$
(3) $10 \%$
(4) $5 \%$
Show Answer
Correct Answer: 33.(4)
Solution: (4) Total jobs in $X$ in 2015
$=5670=35 \%$
$\therefore$ Total jobs in 2015
$=5670 \times \frac{100}{35}=16200$ $\therefore$ Total jobs in country $Z$ in
$2016=\frac{16200}{3}=5400$
Required percentage
$=\left(\frac{5670-5400}{5400}\right) \times 100$
$=\frac{270}{54}=5 \%$


