Data Interpretation Ques 329
Directions: Read the following graph to answer the given question. The questions given below it.
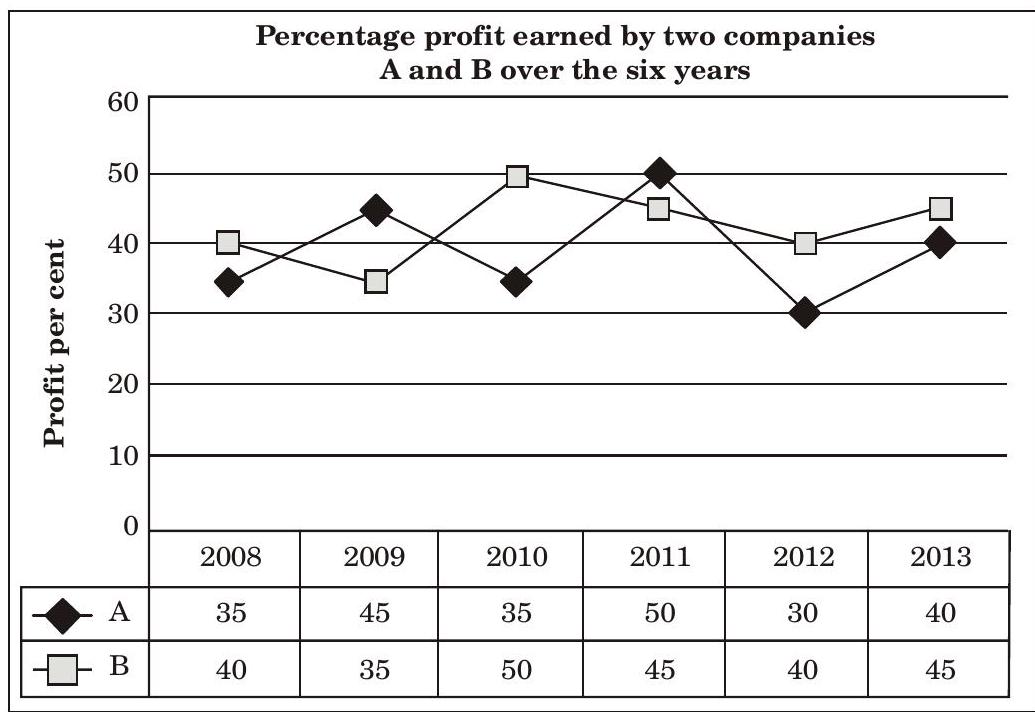
The ratio of expenditures of companies A and B in 2012 was 3 : 4 respectively. What was the respective ratio of their incomes in 2012?
(1) $21: 26$
(2) $13: 14$
(3) $14: 13$
(4) $26: 21$
(5) None of these
Show Answer
Correct Answer: 329.(5)
Solutions: (5) Expenditure of company A in 2012 = Rs. 3 lakhs (let) Expenditure of company B in 2012 = Rs. 4 lakhs (let)
For company A,
$\frac{I_{1}-3}{3}=\frac{30}{100}$
$\Rightarrow I_{1}-3=\frac{9}{10}$
$\Rightarrow I_{1}=3+\frac{9}{10}=$ Rs. $\frac{39}{10}$
khs
For company B,
$\frac{I_{2}-4}{4}=\frac{40}{100}$
$\Rightarrow I_{2}-4=\frac{8}{5}$
$\Rightarrow I_{2}=4+\frac{16}{10}=$ Rs. $\frac{56}{10}$
khs
$\therefore I_{1}: I_{2}=\frac{39}{10}: \frac{56}{10}=39: 56$


