Data Interpretation Ques 32
Directions : The following bar graph shows the percentage of jobs available in the countries $X, Y$ and $Z$ in different years. Study the bar graph and answer the questions given below.
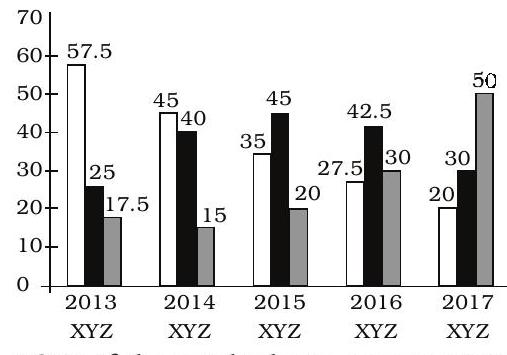
If the ratio of the total jobs available in the years 2013 and 2016 was 3 : 5 and the total jobs in country $X$ in 2016 were 4125 , what were the total jobs in country $Z$ in the year 2013 ?
(1) 1575
(2) 1775
(3) 1555
(4) 1775
(5) 1755
Show Answer
Correct Answer: (1)
Solution: (1) In 2016 , total jobs in country $X=4125$
$\because 27.5 \% \equiv 4125$
$\therefore 100 \% \equiv \frac{4125}{27.5}=$
15,000
$=$ Total jobs in 2016
$\therefore$ Total jobs in 2013
$=15000 \times \frac{3}{5}=900$
$\therefore$ Total jobs in country Z in 2013
$=\frac{9000 \times 17.5}{100}=1575$


