Data Interpretation Ques 31
Directions : The following bar graph shows the percentage of jobs available in the countries $X, Y$ and $Z$ in different years. Study the bar graph and answer the questions given below.
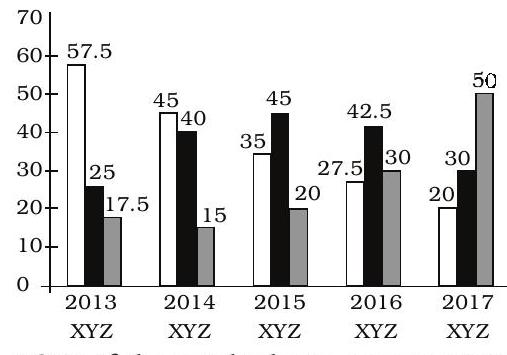
If the total jobs in country $X$ in the year 2014 were equal to the total jobs in country $Y$ in the year 2017 , what is the ratio of the jobs available $Z$ in the respective years?
(1) $2: 3$
(2) $1: 5$
(3) $2: 1$
(4) $1: 3$
(5) $3: 2$
Show Answer
Correct Answer: (2)
Solution: (2) Let, total jobs in $2014=x$; Total jobs in $2017=y$
$\therefore 45 \%$ of $x=30 \%$ of $y$
$\Rightarrow x: y=30: 45$
$\Rightarrow x: y=2: 3$
Required ratio $=15 \%$ of $x: 50 \%$
of $y=15 x: 50 y=\frac{15}{50} \times \frac{2}{3}=$
$1: 5$


