Data Interpretation Ques 3
Directions: The following pie charts show the percentage distribution of the sales of an educational magazine in seven different cities - B, H, T, P, R, G and $K-$ in the years 2016 and 2017 respectively. Consider the following pie-charts carefully and answer the questions given below:
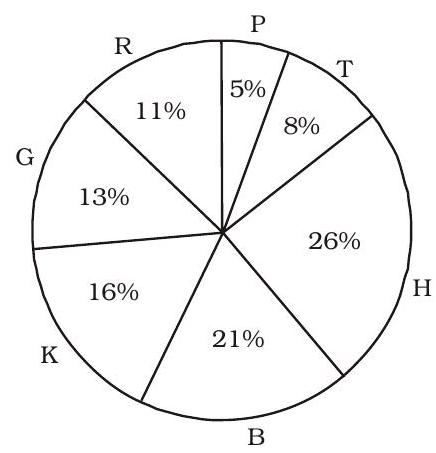
Total number of magazines sold in $2016=87600$
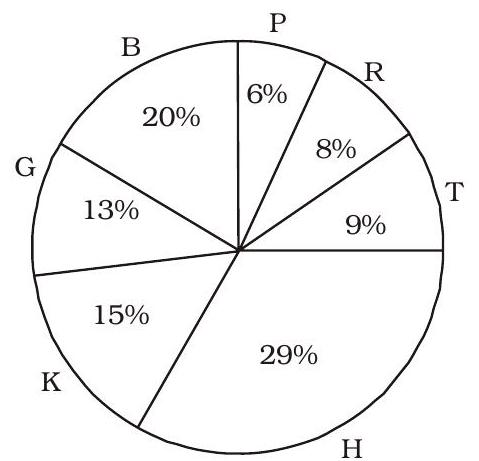
Total number of magazines sold in $2017=96900$
The printing charge per magazine in city H was Rs. 9 in 2016 and Rs. 11 in 2017. What is the difference between the total printing charge incurred on the magazines in 2016 and that in 2017 in city $H$ ?
(1) Rs. 104127
(2) Rs. 124125
(3) Rs. 118127
(4) Rs. 102422
(5) Rs. 139121
Show Answer
Correct Answer: 3.(1)
Solution: (1) Sales in city H in 2016
$=87600 \times \frac{26}{100}=$ Rs. 22776
Total charges incurred in 2016 $=22776 \times 9=$ Rs. 204984
Sales in city H in 2017
$=96900 \times \frac{29}{100}=28101$
Total charges incurred in 2017 $=28101 \times 11=$ Rs. 309111
Required difference
$=$ Rs. $(309111$ - 204984)
$=$ Rs. 104127


