Data Interpretation Ques 221
Directions : Study the following graph carefully and answer the questions given below it.
Number of tourists visiting country ’ $X Y Z$ ’ from city A and city B during 6 different months
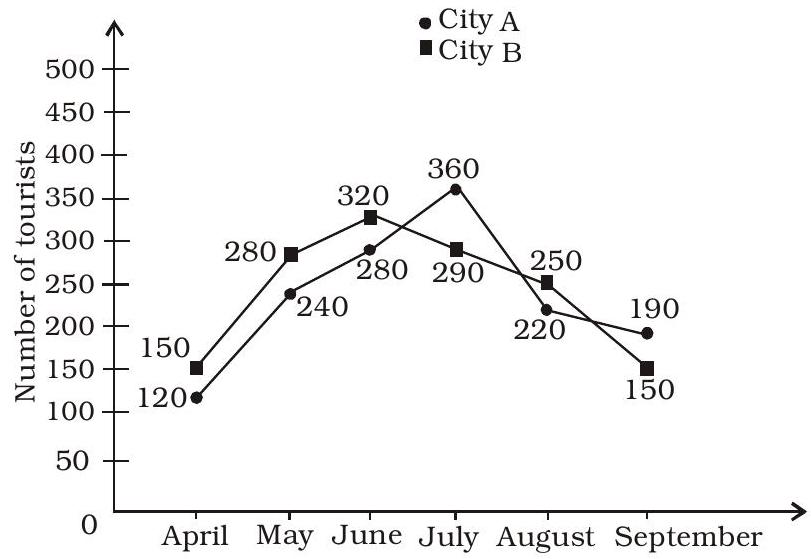
By what percent the number of tourists from city B increased in August in respect to April?
(1) 36.67
(2) 63.57
(3) 65.27
(4) 66.67
(5) None of these
Show Answer
Correct Answer: (4)
Solution: (4) Required percent
$=\frac{250-150}{150} \times 100$
$=\frac{1000}{15}=66.67 \%$


