Data Interpretation Ques 219
Directions : Study the following graph carefully and answer the questions given below it.
Number of tourists visiting country ’ $X Y Z$ ’ from city A and city B during 6 different months
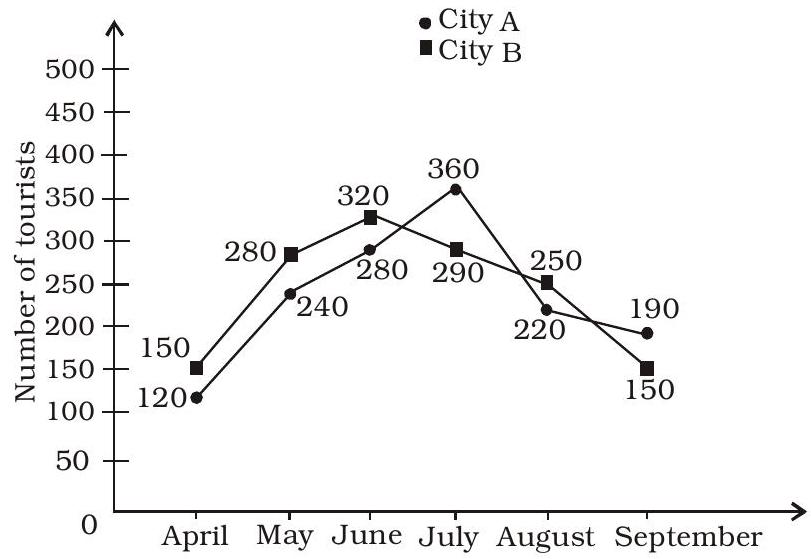
What is the respective ratio between the total number of tourists from states $A$ and $B$ during April, May and June taken together?
(1) $63: 31$
(2) $64: 75$
(3) $31: 63$
(4) $11: 13$
(5) None of these
Show Answer
Correct Answer: (2)
Solution: (2) Required ratio $=(120+240$
$+280):(150+280+320)$
$=640: 750=64: 75$


