Data Interpretation Ques 209
Directions : Refer to the graph and answer the given questions.
Data related to number of elephants in two Reserves A and B of country $X$ during 6 years.
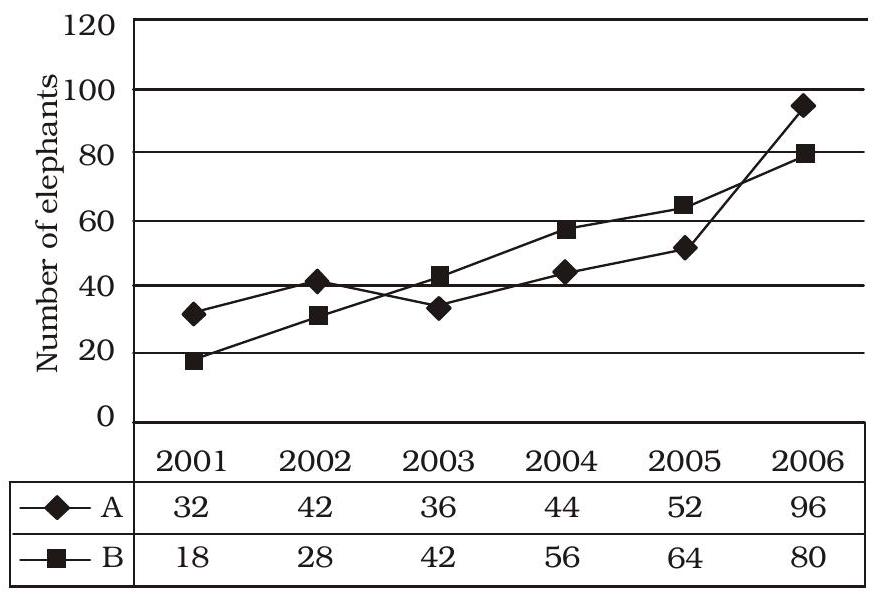
Number of elephants in reserve A decreased by $25 \%$ from 2006 to 2007 and number of elephants in reserve $B$ increased by $15 \%$ from 2006 to 2007. What was the total number of elephants in reserves A and B together in 2007 ?
(1) 172
(2) 164
(3) 158
(4) 174
(5) 166
Show Answer
Correct Answer: (2)
Solution: (2) Number of elephants in 2007 :
Reserve $A \Rightarrow \frac{96 \times 75}{100}=72$
Reserve $B \Rightarrow \frac{80 \times 115}{100}=92$
$\therefore$ Total number of elephants in 2007
$=72+92=164$
Calculations (389-393) :
Cost price of 1 mouse
$=$ Rs. 1000
C.P. of 1 table
Rs. $(13.5 \times 1000)=$ Rs.
13500
C.P. of 1 chair
$=$ Rs. $\left(\frac{3}{5} \times 13500\right)$
$=$ Rs. 8100
C.P. of 1 air conditioner
$=$ Rs. $(8100 \times 5)$
$=$ Rs. 40500
C.P. of 1 monitor
$ \begin{aligned} & =\frac{8100 \times 120}{100} \\ & =\text { Rs. } 9720 \\ & \text { C.P. of } 1 CPU \\ & =\text { Rs. }(13500+1500) \\ & =\text { Rs. } 15000 \\ & \text { C.P. of } 1 \text { key-board } \\ & =\text { Rs. }(4 \times 1000) \\ & =\text { Rs. } 4000 \end{aligned} $


