Data Interpretation Ques 196
Directions : The following questions are based on a piechart and a table. The pie chart deals with percentagewise distribution of sales of mobile phones of three brands by a store $X$ in the year 2013 where as the table deals with the ratio of respective sales. You are required to study the pie-chart and the table carefully to answer the questions.
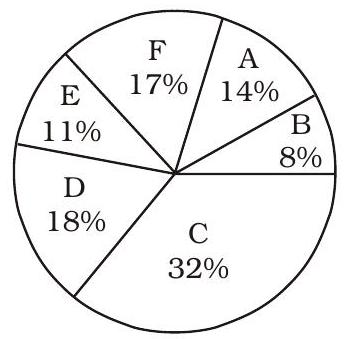
Percentage-wise Distribution of sales of mobile phones by 6 stores- A, B, C, D, E and F.Total number of mobile phones sold $\mathbf{=} \mathbf{6 6 0 0 0}$
Ratio of mobile phones sold by all stores
| Stores | Nokia | Samsung | HTC |
|---|---|---|---|
| Brands | |||
| A | $2:$ | $3:$ | 2 |
| B | $6:$ | $5:$ | 5 |
| C | $3:$ | $3:$ | 2 |
| D | $5:$ | $2:$ | 2 |
| E | $3:$ | $3:$ | 5 |
| F | $7:$ | $6:$ | 7 |
How many mobile phones (including all three brands) were sold by stores $D, E$ and $F$ ?
(1) 29360
(2) 30630
(3) 30360
(4) 31360
(5) None of these
Show Answer
Correct Answer: (3)
Solution: (3) Total number of mobile phones sold by stores D, E and $F$
$=(18+11+17) \%$ of 66000
$=\frac{66000 \times 46}{100}=30360$


