Data Interpretation Ques 174
Directions : In the following graph, production of rice per hectare (in quintal) during last six years in three states of West Bengal, Odisha and Andhra Pardesh has been shown, Study the graph carefully and answer the questions given below it.
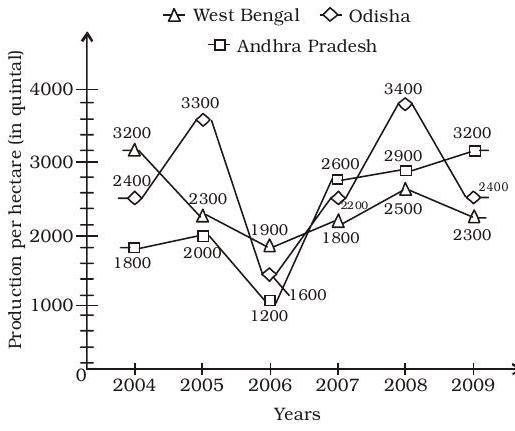
In which year was the production of rice per hectare by all three states highest?
(1) 2009
(2) 2004
(3) 2008
(4) 2006
(5) 2007
Show Answer
Correct Answer: (3)
Solution: (3) Total production per year:
Year $2004 \Rightarrow 7400$ quintals
Year $2005 \Rightarrow 3300+2300+2000$ $=7600$ quintals
Year $2006 \Rightarrow 1900+1600+$
$1200=4700$ quintals
Year $2007 \Rightarrow 6600$ quintals
Year $2008 \Rightarrow 3400+2900+$
$2500=8800$ quintals
Year $2009 \Rightarrow 3200+2400+$
$2300=7900$ quintals


