Data Interpretation Ques 148
Directions : To answer the questions given below, study the following pie-chart and the table carefully.
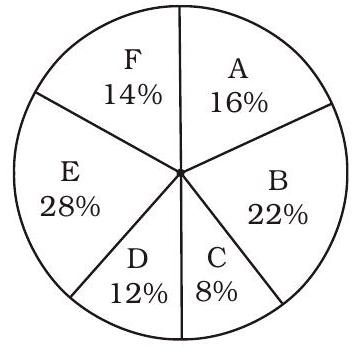
Total production of nylon and cotton clothes by 6 companies A, B, C, D, $E$ and $F$ in the year $2013=84000$
Percentage-wise Distribution
| Company | Ratio of nylon and cotton clothes |
|---|---|
| A | $7: 5$ |
| B | $5: 7$ |
| C | $5: 2$ |
| D | $5: 3$ |
| E | $4: 3$ |
| F | $9: 5$ |
The difference between the average number of cotton clothes manufactured by companies A, $C$ and $E$ and that of cotton clothes manufactured by companies $B, D$ and $F$ is
(1) 35
(2) 38
(3) 40
(4) 42
(5) 45
Show Answer
Correct Answer: (2)
Solution: (2) Manufactured cotton clothes :
Company A
$\Rightarrow 8400 \times \frac{16}{100} \times \frac{5}{12}=560$
Company C
$\Rightarrow 8400 \times \frac{8}{100} \times \frac{2}{7}=192$
Company E
$\Rightarrow 8400 \times \frac{28}{100} \times \frac{3}{7}=1008$
Average production
$=\frac{560+192+1008}{3}$
$=\frac{1760}{3} \approx 587$
Company B
$\Rightarrow 8400 \times \frac{22}{100} \times \frac{7}{12}=1078$
Company D
$\Rightarrow 8400 \times \frac{12}{100} \times \frac{3}{8}=378$
Company F
$\Rightarrow 8400 \times \frac{14}{100} \times \frac{5}{14}=420$
Average production
$\Rightarrow \frac{1078+378+420}{3}$
$=\frac{1876}{3} \approx 625$
Difference $=625-587=38$


