Data Interpretation Ques 14
Directions : Refer to the following graph and answer the given questions.
A school collected data from April 2014 to April 2018 comprising students of class XI who opted for either science stream or commerce stream
(Note : There are only two streams available in the school i.e. Science and Commerce)
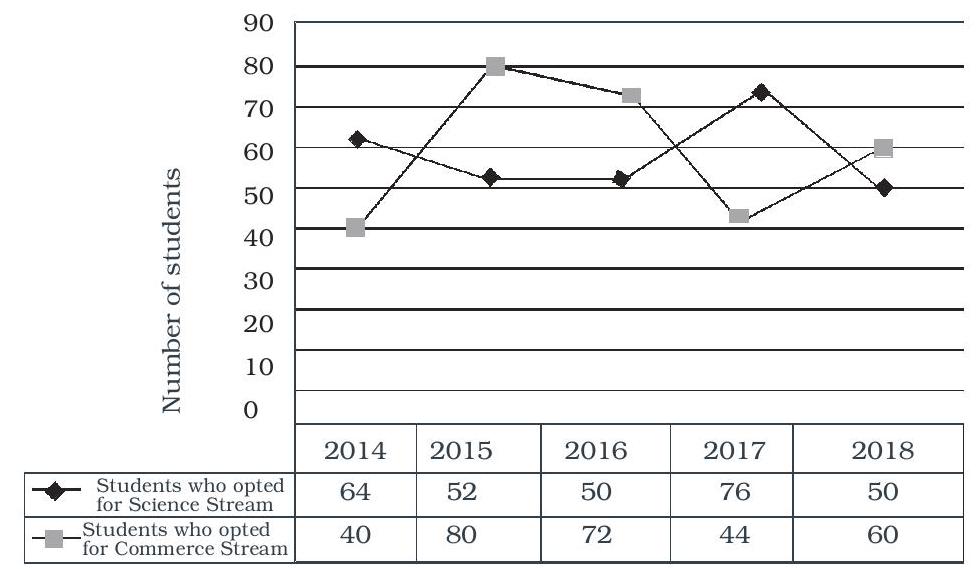
If the number of students who opted for science stream in 2019 was 10\% more than that in 2016 and the number of students (commerce + science streams) in 2019 was $25 \%$ less than that in 2015 , how many students opted for commerce stream in 2019?
(1) 40
(2) 42
(3) 44
(4) 52
(5) 50
Show Answer
Correct Answer: (3)
Solution: (3) Number of students who opted for science stream in 2019
$=\frac{50 \times 110}{100}=55$
Total number of students (science and commerce streams) in $2015=52+80=132$
$\therefore$ Their number in 2019
$=\frac{132 \times 75}{100}=99$
$\therefore$ Number of students who opt for commerce stream in $2019=$ $99-55=44$


