Data Interpretation Ques 124
Directions : Study the following pie-chart and table carefully and answer the questions given below :
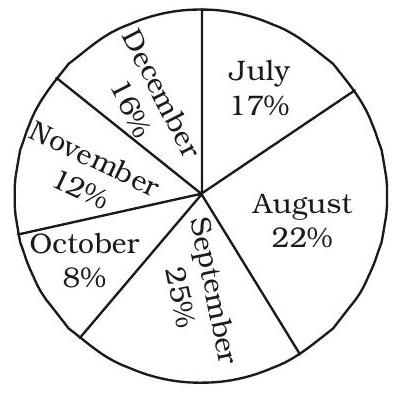
Percentage wise Distribution of the Number of Mobile Phones Sold by A Shopkeeper During Six Months Total number of mobile phones sold $\mathbf{=} \mathbf{4 5 0 0 0}$
The respective ratio between the number of mobile phones sold of company $A$ and company $B$ during six months
| Month | Ratio |
|---|---|
| July | $8: 7$ |
| August | $4: 5$ |
| September | $3: 2$ |
| October | $7: 5$ |
| November | $7: 8$ |
| December | $7: 9$ |
(1) 10,000
(2) 15,000
(3) 10,500
(4) 9.5 thousand
(5) None of these
Show Answer
Correct Answer: (1)
Solution: (1) Mobile phones sold by company B :
August $\Rightarrow \frac{5}{9} \times 45000 \times \frac{22}{100}$
$=5500$
September
$\Rightarrow \frac{2}{5} \times 45000 \times \frac{25}{100}=4500$
Sum $=5500+4500$
$=10000$


