Data Interpretation Ques 119
Directions : Study the following graph and table carefully and answer the questions given below
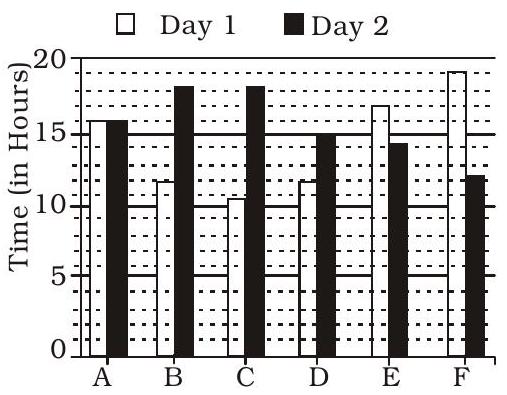
Time Taken to Travel (in hours) By Six Vehicles On Two Different Days
Vehicles Distance covered (in kilometres) by six vehicles on each day
| Vehicle | Day 1 | Day 2 |
|---|---|---|
| A | 832 | 864 |
| B | 516 | 774 |
| C | 693 | 810 |
| D | 552 | 765 |
| E | 935 | 546 |
| F | 703 | 636 |
What is the respective ratio between the speed of vehicle $D$ and vehicle $E$ on day 2 ?
(1) $15: 13$
(2) $17: 13$
(3) $13: 11$
(4) $17: 14$
(5) None of these
Show Answer
Correct Answer: 2
Solution: (2) Required ratio
$ \begin{alignedat} & =\frac{765}{15}: \frac{546}{14} \\ & =51: 39=17: 13 \end{aligned} $


