Data Interpretation Ques 11
Directions : Refer to the following graph and answer the given questions.
A school collected data from April 2014 to April 2018 comprising students of class XI who opted for either science stream or commerce stream
(Note : There are only two streams available in the school i.e. Science and Commerce)
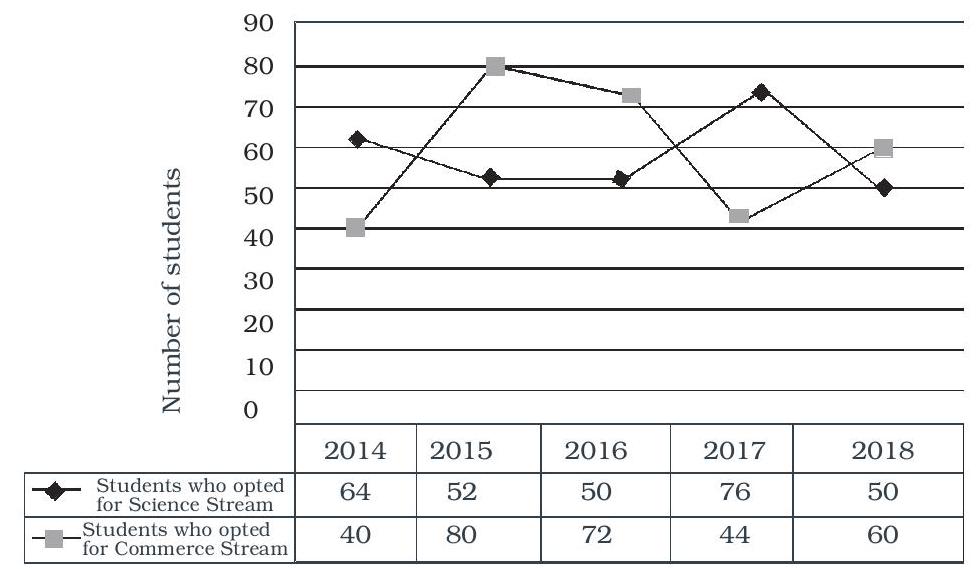
The number of students who opted for commerce stream decreased by what percent from 2015 to 2017 ?
(1) 45
(2) 55
(3) 42
(4) 49
(5) 52
Show Answer
Correct Answer: 11.(1)
Solution: (1) Number of students in commerce stream :
Year $2015 \Rightarrow 80$
Year $2017 \Rightarrow 44$
Required percentage decrease
$=\left(\frac{80-44}{80}\right) \times 100$
$=\frac{36 \times 5}{4}=45 \%$


